Track record
Performance
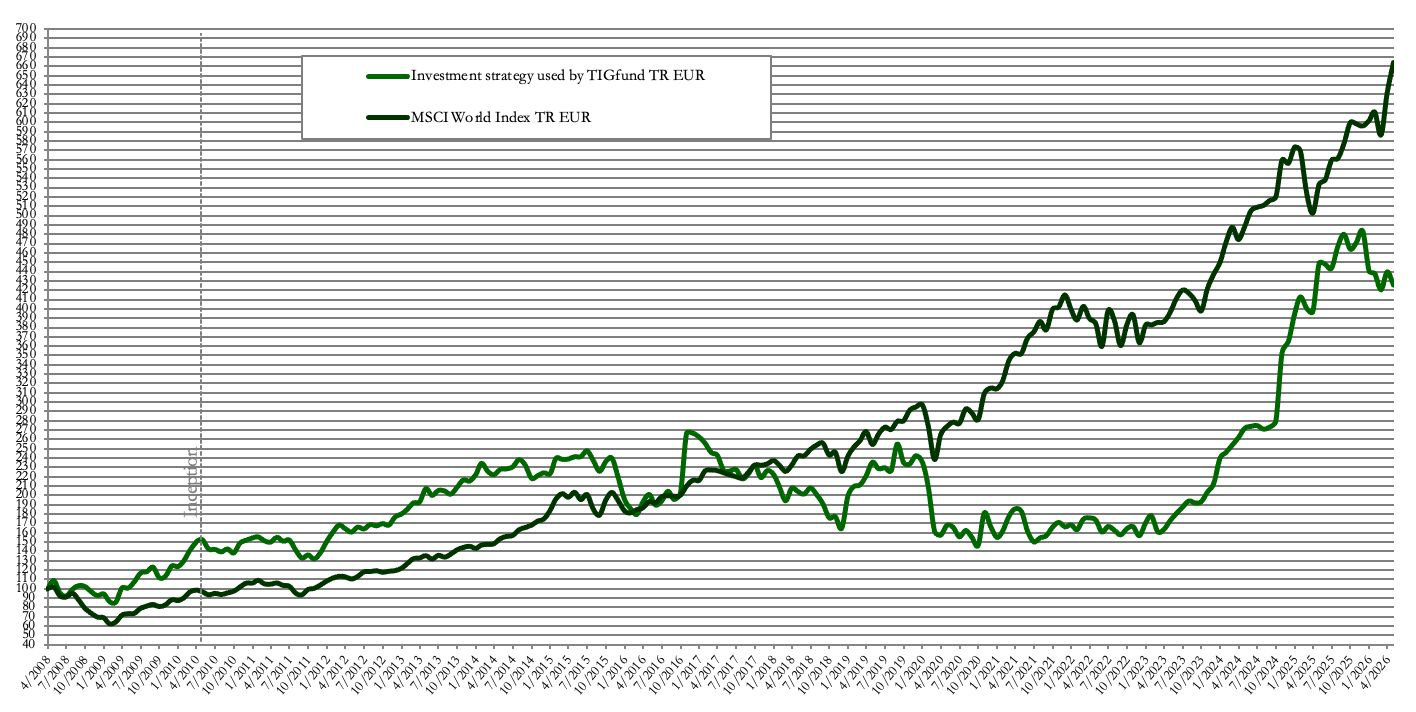
Performance of Investment Strategy* vs. MSCI World Index TR
![]()
*Includes pre-fund and since fund inception results. The live track record started in May 2008; TIGfund started in May 2010.
| Year | Jan | Feb | Mar | Apr | May 11* | May | Jun | Jul | Aug | Sep | Oct | Nov | Dec | Year Result |
|---|---|---|---|---|---|---|---|---|---|---|---|---|---|---|
| 2008 | 9,1% | -12,0% | -3,6% | 8,0% | 3,9% | -1,0% | -5,3% | -4,3% | -6,9% | |||||
| 2009 | 1,8% | -8,6% | -0,9% | 17,6% | 0,0% | 6,6% | 8,9% | 1,2% | 4,0% | -9,2% | 1,6% | 9,5% | 33,9% | |
| 2010 | -0,5% | 5,0% | 8,9% | 5,9% | 1,2% | 0,3% | -6,5% | -0,2% | -1,9% | 2,3% | -3,0% | 7,5% | 2,2% | 22,2% |
| 2011 | 1,5% | 0,7% | -2,7% | -0,9% | 3,4% | -2,8% | 0,8% | -7,1% | -6,0% | 2,5% | -3,1% | 5,2% | -8,7% | |
| 2012 | 8,8% | 6,2% | 4,9% | -2,4% | -2,2% | 3,3% | -1,2% | 2,9% | -0,8% | 1,4% | -1,0% | 5,2% | 27,4% | |
| 2013 | 1,8% | 2,7% | 3,8% | 0,5% | 7,4% | -3,5% | 2,7% | -0,3% | -1,7% | 3,7% | 3,7% | -0,5% | 21,7% | |
| 2014 | 3,3% | 5,4% | -3,7% | -1,5% | 2,6% | 0,2% | 0,9% | 3,3% | -2,4% | -6,1% | 1,2% | 1,4% | 4,1% | |
| 2015 | -0,3% | 7,2% | -0,4% | 0,2% | 1,0% | 0,0% | 2,6% | -4,3% | -4,8% | 4,6% | 1,5% | -8,7% | -2,5% | |
| 2016 | -10,6% | -4,8% | -3,4% | 7,4% | 4,1% | -5,6% | 2,3% | 5,3% | -4,3% | 3,5% | 31,5% | 0,1% | 21,9% | |
| 2017 | -1,6% | -2,4% | -4,0% | -1,3% | -6,6% | -0,3% | 0,7% | -4,3% | 2,5% | 4,1% | -5,7% | 3,4% | -15,0% | |
| 2018 | -1,8% | -5,8% | -7,2% | 6,9% | -1,8% | -1,2% | 3,3% | -3,6% | -4,8% | -7,9% | 0,7% | -7,0% | -27,2% | |
| 2019 | 21,0% | 4,9% | 0,9% | 4,5% | 6,6% | -2,9% | 0,4% | -1,4% | 12,6% | -7,8% | -0,6% | 3,8% | 47,1% | |
| 2020 | -2,9% | -11,2% | -22,7% | -2,6% | 6,7% | -1,3% | -6,1% | 4,3% | -4,4% | -5,5% | 23,6% | -8,0% | -31,2% | |
| 2021 | -7,0% | 4,3% | 9,8% | 4,5% | -1,5% | -11,5% | -7,2% | 2,9% | 1,4% | 5,9% | 3,0% | -2,8% | -0,3% | |
| 2022 | 1,2% | -3,0% | 6,9% | 0,8% | -1,3% | -7,2% | 3,6% | -2,5% | -2,9% | 4,2% | 1,3% | -5,9% | -5,7% | |
| 2023 | 8,9% | 4,3% | -9,5% | 1,4% | 5,8% | 4,3% | 3,9% | 3,5% | -1,1% | 0,8% | 5,3% | 4,5% | 35,6% | |
| 2024 | 12,8% | 2,4% | 3,3% | 3,1% | 3,8% | 0,7% | 0,3% | -1,4% | 0,8% | 2,5% | 25,8% | 3,5% | 71,3% | |
| 2025 | 8,1% | 4,6% | -3,0% | -0,9% | 13,1% | -0,2% | -0,9% | 5,3% | 2,8% | -3,3% | 1,6% | 2,6% | 32,4% | |
| 2026 | -8,8% | -0,6% | -4,0% | 4,6% | -3,2% | -11,9% |
Results from June 1, 2010 include results after fees. Before June 2010, results do not include fees as no fees were charged.
All returns are total return (TR) based, i.e. TR includes dividends. *11 May 2010 is fund start date. The live track record started in May 2008; TIGfund started in May 2010.
| Year | Year Result | MSCI World TR Year | Year vs MSCI | Cumulative | MSCI World TR Cumulative | Cumulative vs MSCI |
|---|---|---|---|---|---|---|
| 2008 | -6,9% | -30,3% | 23,4% | -6,9% | -30,3% | 23,4% |
| 2009 | 33,9% | 26,7% | 7,2% | 24,7% | -11,7% | 36,4% |
| 2010 | 22,2% | 20,1% | 2,1% | 52,4% | 6,1% | 46,3% |
| 2011 | -8,7% | -1,8% | -6,9% | 39,1% | 4,1% | 35,0% |
| 2012 | 27,4% | 14,7% | 12,7% | 77,3% | 19,5% | 57,8% |
| 2013 | 21,7% | 21,9% | -0,2% | 115,7% | 45,6% | 70,1% |
| 2014 | 4,1% | 20,1% | -16,1% | 124,5% | 74,9% | 49,6% |
| 2015 | -2,5% | 11,0% | -13,5% | 119,0% | 94,2% | 24,8% |
| 2016 | 21,9% | 11,4% | 10,5% | 166,9% | 116,3% | 50,6% |
| 2017 | -15,0% | 8,1% | -23,1% | 126,9% | 133,9% | -7,0% |
| 2018 | -27,2% | -3,6% | -23,7% | 65,1% | 125,5% | -60,4% |
| 2019 | 47,1% | 30,8% | 16,3% | 142,9% | 194,9% | -52,0% |
| 2020 | -31,2% | 6,9% | -38,1% | 67,1% | 215,2% | -148,1% |
| 2021 | -0,3% | 31,6% | -31,9% | 66,6% | 314,9% | -248,2% |
| 2022 | -5,7% | -12,3% | 6,6% | 57,1% | 263,7% | -206,5% |
| 2023 | 35,6% | 20,2% | 15,4% | 113,1% | 337,1% | -224,0% |
| 2024 | 71,3% | 27,2% | 44,1% | 265,0% | 455,9% | -190,8% |
| 2025 | 32,4% | 7,2% | 25,2% | 383,2% | 495,9% | -112,7% |
| 2026 | -11,9% | 11,4% | -23,3% | 325,6% | 564,0% | -238,4% |
All returns are total return (TR) based, i.e. TR includes dividends. The live track record started in May 2008; TIGfund started in May 2010.